Statistics
For more visibility, the statistics are grouped in categories according to the email status:
Volume sent
These statistics sum up your sending status depending on a chose time slot and the filter(s). They are devided into three sections:
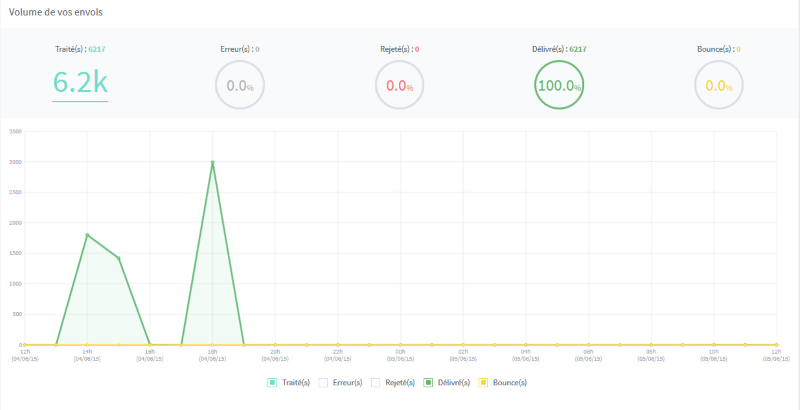
- The key figures sum up your sendings' volume and your emails' status. Then you have the number of sent emails, the emails in error, the rejected emails, the delivered emails and the bounces. For more details, you can read the dedicated emails' status article.
- The graph uses the same data. It displays them over time according to the selected time slot.
- the tops diplays the most used tags and also the most used recipients' domains. Clicking on the “Mode details”, you will get a new window displaying tags or domains' key indicators.
Status of emails
These statistics summarize the actions resulting of your sendings (open, read). It is composed of three sections:
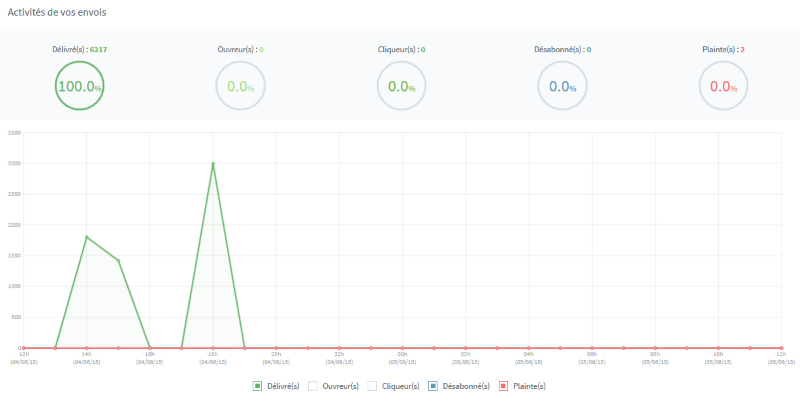
- Key indicators summarize the status linked to your emails activity. Here you have the number of delivered emails, openings, clicks, unsubscriptions and complains. For more details over the emails status, you can read the dedicated article : emails status
- The graph displays delivered emails, unique openings, unique clicks, unsubcriptions and complains linked to your sendings
- The top links displays the most clicked links.
Technologies
These statistics sum up the way your recipients open their emails. These data are split into two categories:
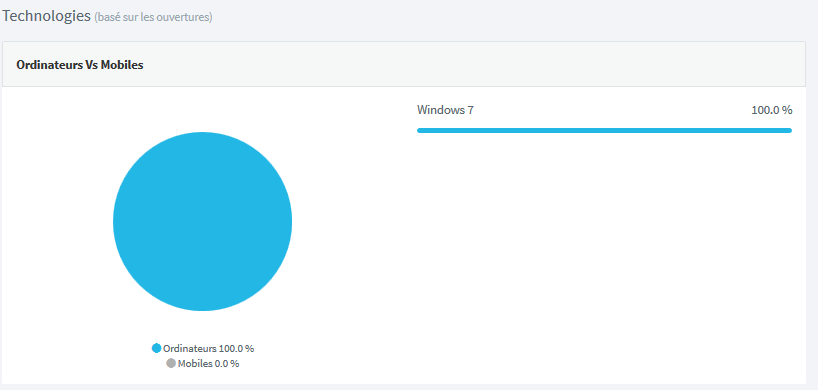
- Desktops vs Mobiles allows you to know the repartition of devices used to open the emails. You not only have this split but also have the details (iphone 6, iphone 6 plus, android, mac, windows)
- Applications vs Webmails allows you to know the tools used to read the emails. It can be very usefull to know which app or webmail is used in order to adapt the content to the said tool.
Map traffic
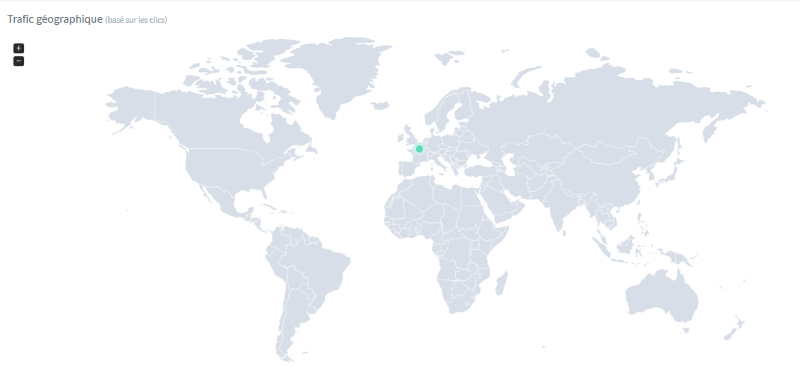
These statistics sum up the places where your recipients clicked your emails. Dots are placed on the zoomable map.
If you click on the Details button, you will get the repartition and details over your sendings.
The filters
In order to help you analyse the statistics, we sent filters allowing you to improve your research.
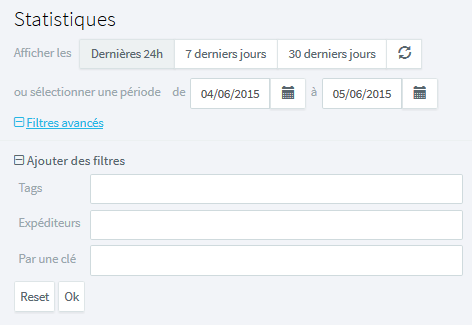
- Period : you can filter the results according to several predefined periods. You can also chose your own time slot on a 90 days maximal scale starting from the actual day (90 days of data retention).
- Tags : gives the list of used tags on at least one email. Tags are elements added to your emails allowing you to identify their types (confirm order, reset password...)
- Froms : gives the expeditors' list
- Via keys : gives the APIs keys' descriptions
Adding up these filters will make your data retrieving easy.