Dashboard
The Dashboard page presents a synthesis of your sendings depending on a time slot.
This page is composed of threee parts:
The filter

The filter allows you to modify the time slot selection concerning your data's visualization. You can chose between:
- The last 24 hours since your connexion time
- The last 7 days since your connexion time
- The last 30 days since your connexion time
- Manual refresh
- Live traffic : the graph will refresh as soon as an event will be recorded by the platform
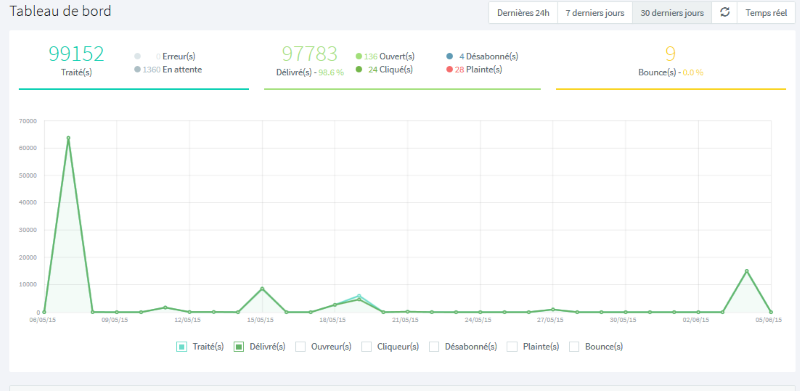
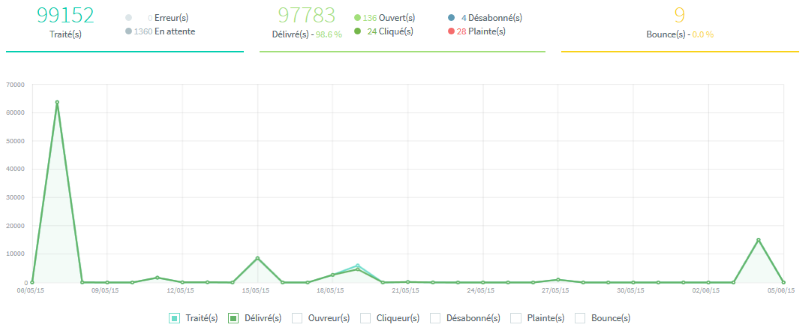
The graph
The graph represents your sendings' evolution and your emails status. You can easily see the number of sent emails and the activity made by its recipient (open, clic, unsubscribe...). for more details on the emails' status, we invite you to read the dedicated article Emails status.
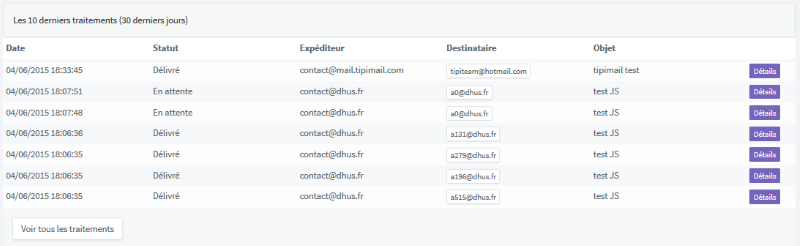
the latest sendings
Finally, the bottom page's board displays the latest sendings made through Tipimail with related status.